Aren't Manual Counts Enough?
An old piece of agronomic wisdom is that we don’t aim for perfect - we just aim for better.
Compared to not doing plant counts at all, even a few manual counts can be valuable.
Stand data is a foundational piece that affects the rest of the system - cost of seed, yield potential, insect/disease management, lodging risk, maturity/desiccation timing, and weed competition.
The benefits of manual counts are:
Simple (easy to interpret)
Flexible (anyone can do them)
Reliable (rain, wind, or shine)

The Hard Part about Manual Counts
While it’s easy to go out and count a few plants, knowing which ‘few plants’ to count is the real problem.
Some people prefer to remove bias by doing a blind hoop throw. Others will look around and try to pick the most representative spot in an area (this was my preference). Neither approach tends to deliver unbiased, representative samples.
And no approach is perfect, but is there better?
Sampling Error Experiment
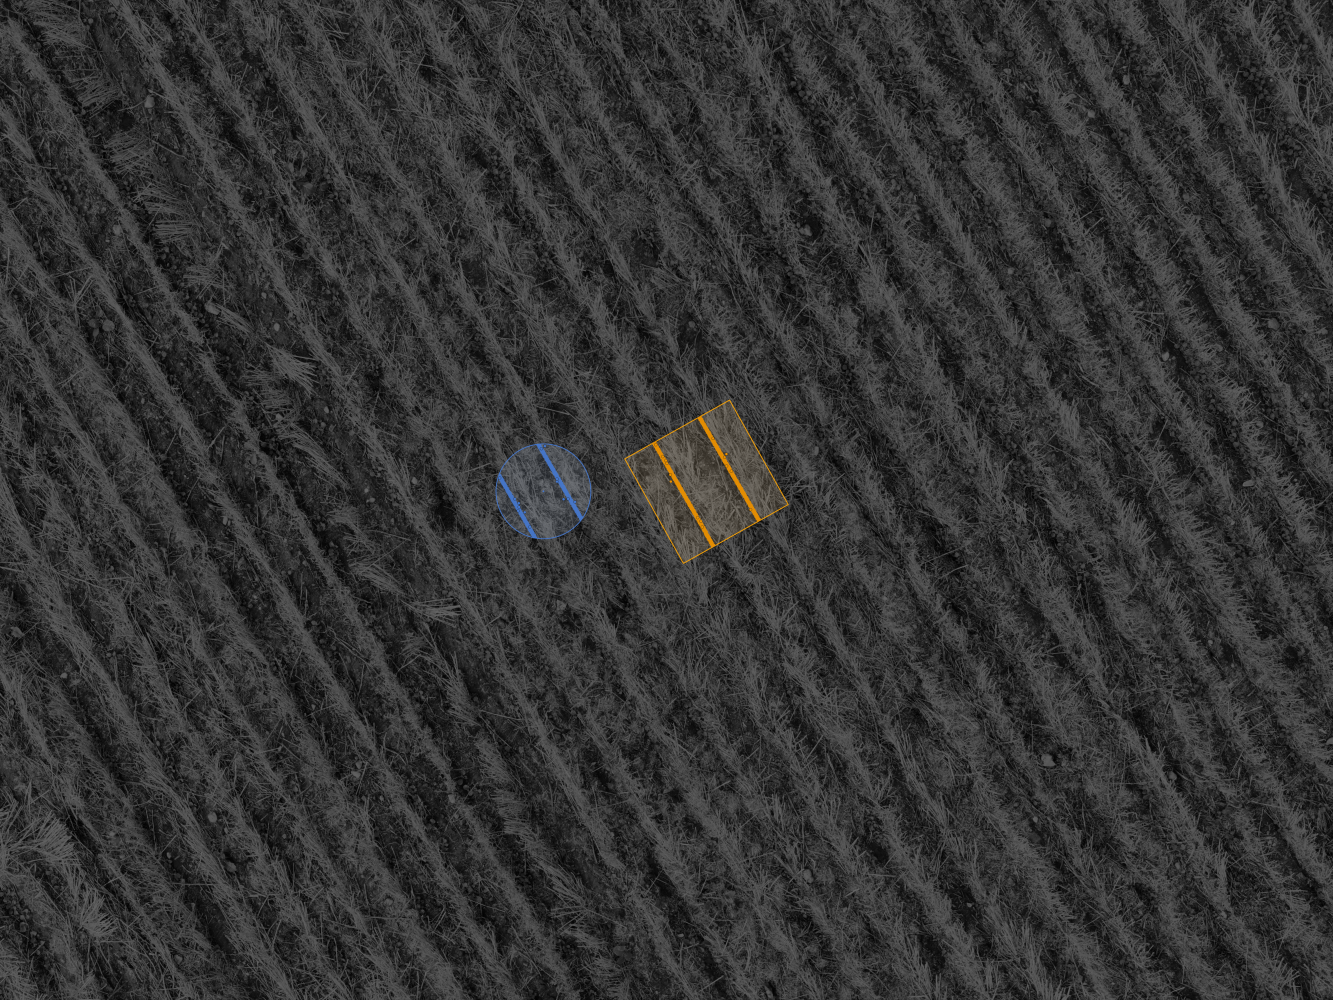
To see how manual sampling really performs, I ran an experiment to compare these two methods with photo based counts:
Hoop (2ft²)
Stick (2ft) - counted over two rows
We generated synthetic manual sample data over 619 canola/lentil drone photos from West Central SK, collected in the spring of 2025.
For the chart below:
The y-axis shows relative error (%) between sample and full photo density
The x-axis shows how averaging multiple spots improves density estimation
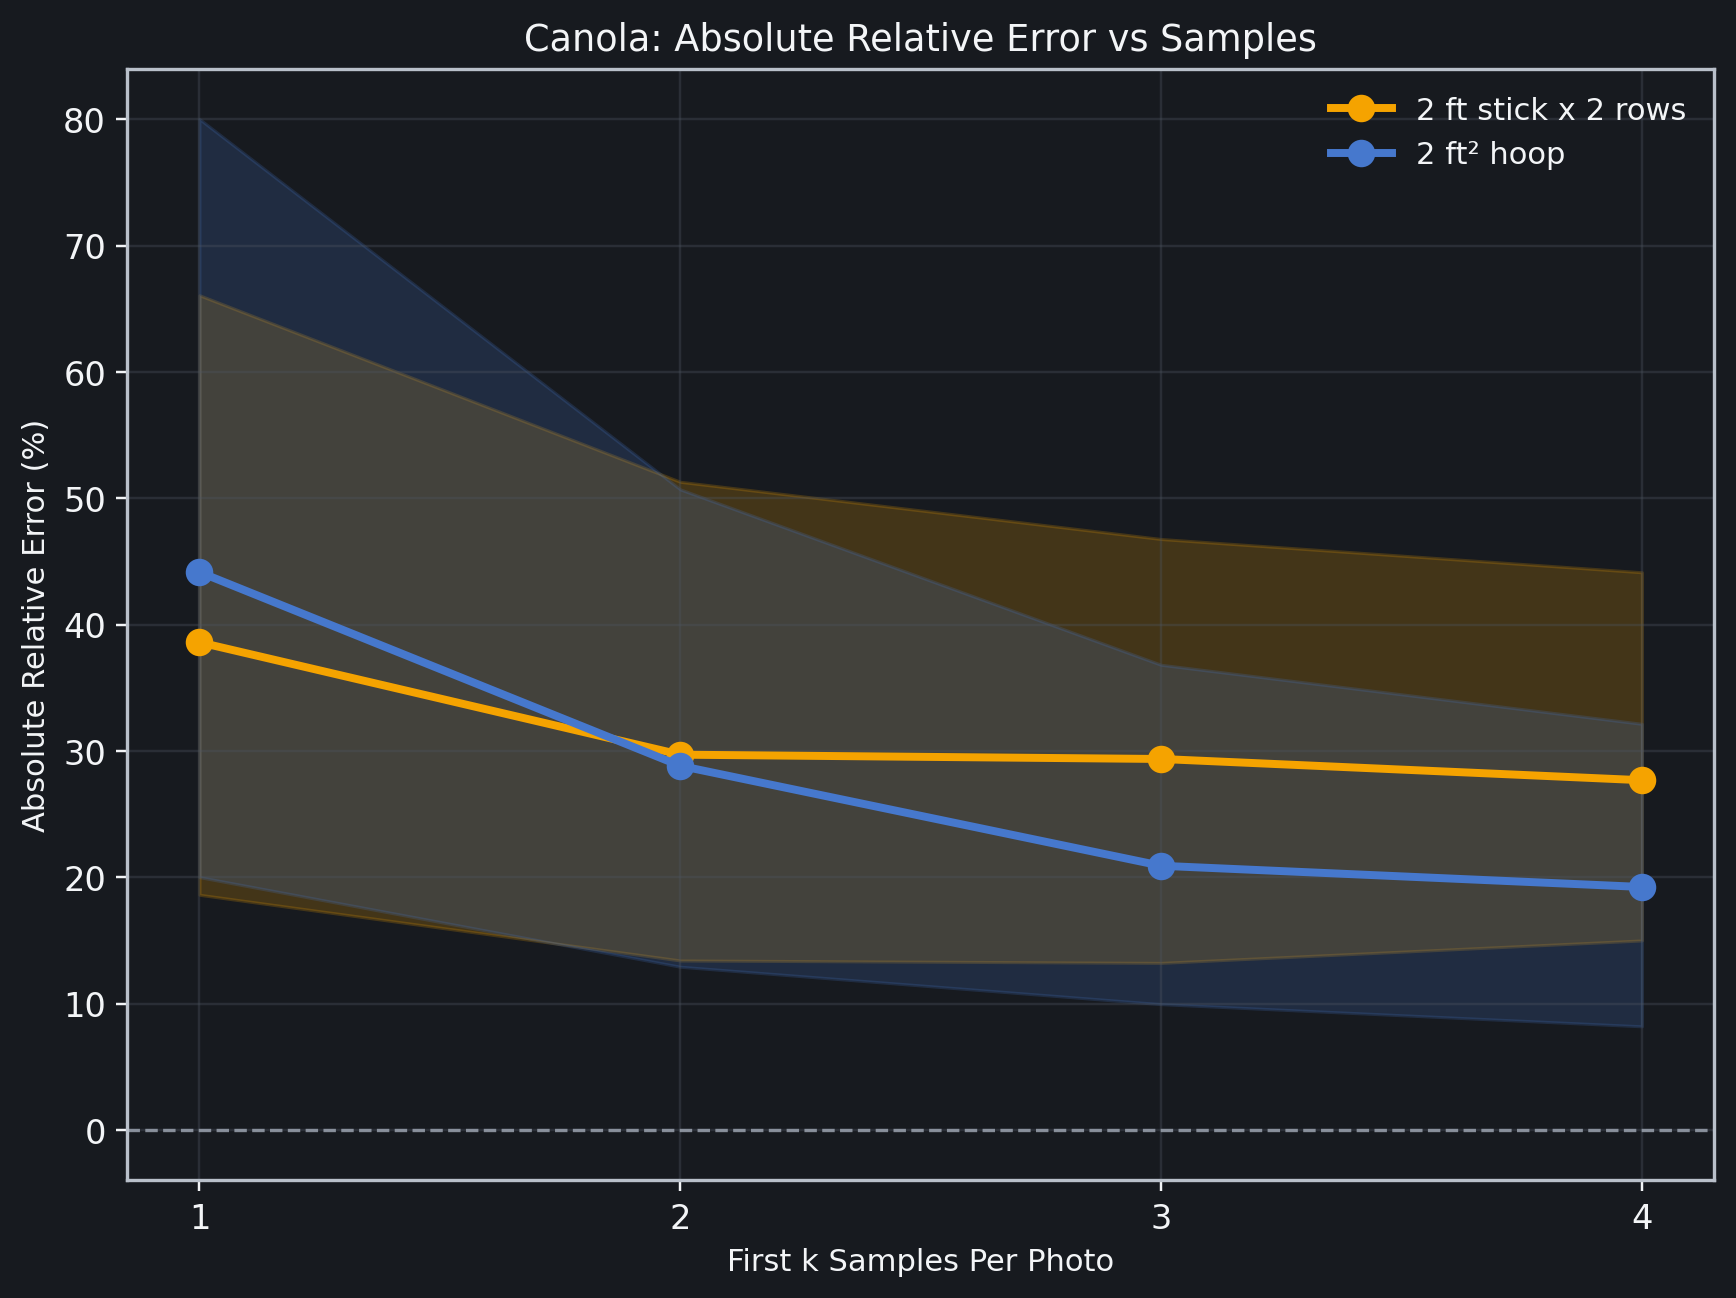
Results
Taking one sample on each canola photo resulted in a median error of 38.6-44.2% compared to the full photo density.
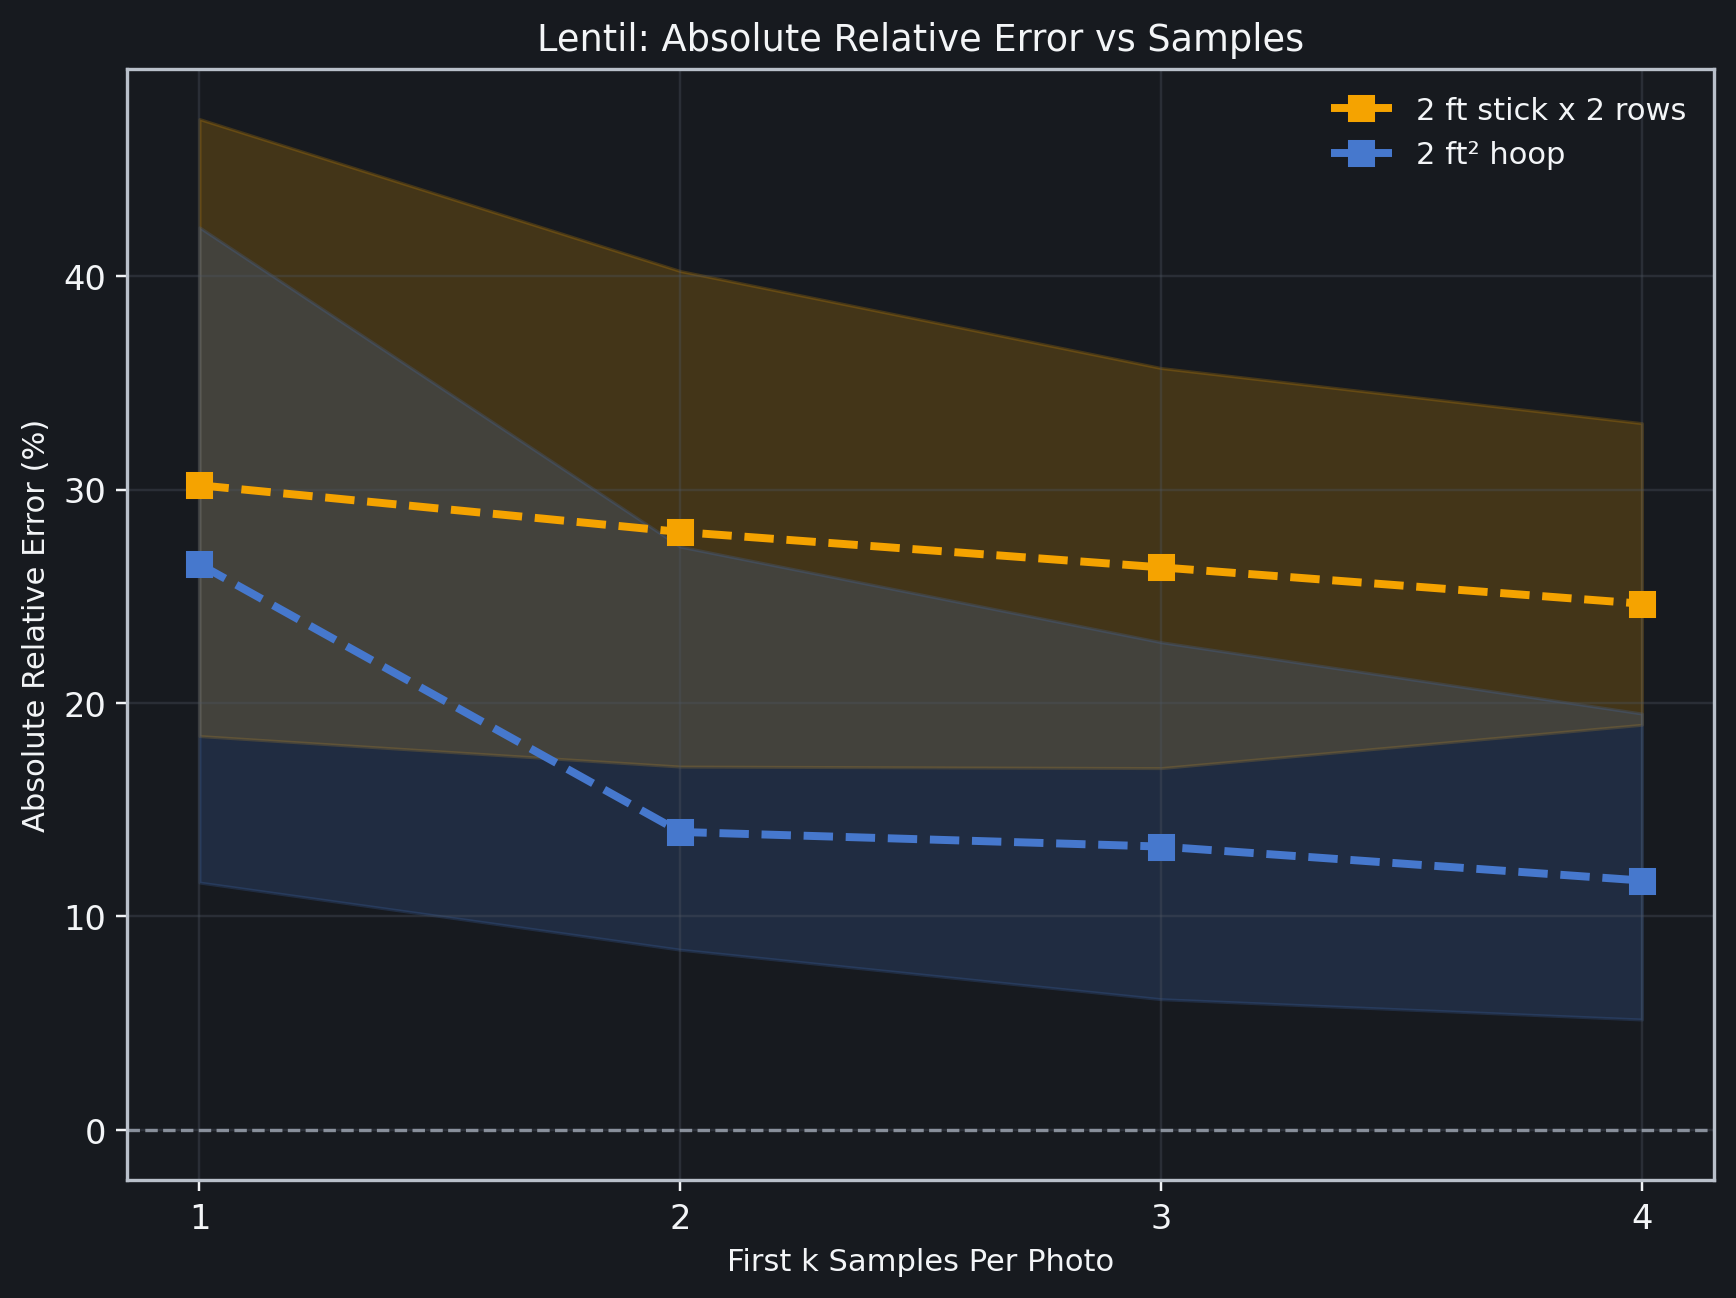
For lentils, taking one sample resulted in 26.5-30.2% error compared to the full photos.
The hoop approach improved more than the stick when averaging multiple samples.
Conclusion
While manual plant counting with a hoop or stick is better than nothing, it's still limited in capturing the true stand for an area.
Variable rate seeding prescriptions often only changes a few percent between each zone. Photo based counts provide a way to collect unbiased, representative samples of this data, so you know if you're on the right track or not.
Data
It should be noted that 2025 was a dry spring. The results for manual sampling might improve with better early season conditions.
These are the results for adding each additional sample (k) in absolute relative error (%).
Canola:
| Samples(k) | 2 ft stick x 2 rows(error %) | 2 ft² hoop(error %) |
|---|---|---|
| 1 | 38.6% | 44.2% |
| 2 | 29.7% | 28.8% |
| 3 | 29.4% | 20.9% |
| 4 | 27.7% | 19.2% |
Lentil:
| Samples(k) | 2 ft stick x 2 rows(error %) | 2 ft² hoop(error %) |
|---|---|---|
| 1 | 30.2% | 26.5% |
| 2 | 28.0% | 14.0% |
| 3 | 26.4% | 13.3% |
| 4 | 24.7% | 11.7% |
Article highlights
619 photos
Synthetic sample set
39-44%
One-sample canola error
27-30%
One-sample lentil error
PlantCounts
Reliable stand data without hours of manual counting.
Built for agronomy in Saskatchewan.
© 2026 NovaScout. All rights reserved.