Case Study 1 - Multi-Res Canola
When scouting fields on foot or in the air, there is always a tradeoff between coverage and detail.
To train our model, we collected both high resolution data for detailed accuracy, and lower resolution data to support better coverage. We've built a way to align data across cameras so we can train and predict across a range of GSD (Ground Sample Distance).
Out in the field, we want a comfortable altitude buffer with any drone that we use. To achieve this, our model has to perform well under a range of conditions and GSD.
Data Collection
To create a multi-resolution dataset we trigger multiple cameras on the Matrice 4E at each waypoint. We align the high resolution telephoto frame into the lower res ‘Med-tele’ frame so they share the same pixel space and can share labels.

Here’s a closeup of the two camera sources sharing the same pixel space.

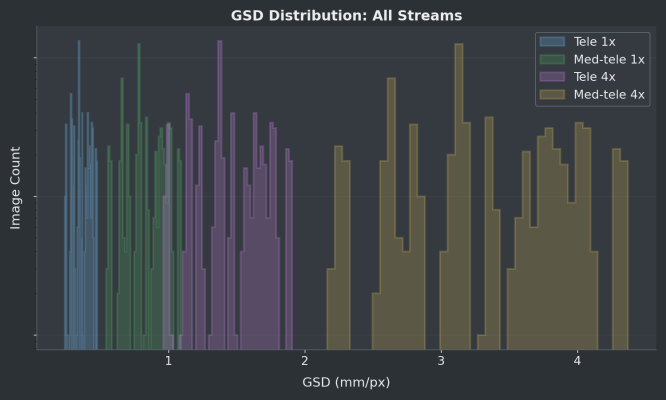
We down sample each stream by 4x so we end up with 4 total streams of data coming from a single waypoint mission.
Tele 1x
Tele 4x
Med-tele 1x
Med-tele 4x (only used to train rows)
By flying each field at a different altitude, we get a smooth GSD distribution in our training data.
Filtering
With any mission, we only want to use the 'good' photos for our analysis.
Other than GSD/stage, here are our constraints around data collection:
Row spacing must be known (in or cm)
Camera must be facing downward (nadir)
Rows must not cross or meet at an angle
The row detector can handle slight curves, but scale accuracy depends on reasonable row spacing, so stay toward the interior of the field where rows are straight if you can.
PlantCounts has a 'Review' step to accept or dispute any photo based on how the row inference turned out, so you're only using credits on results with high scale accuracy.
Case Study 1 - Canola (Major, SK)
The first case study is a canola field we flew in the spring of 2025. This field was held out from training.
Methods
We followed our typical R&D collection approach:
Tele and Med-tele at each waypoint
5 waypoints for each soil zone (10 zones)
1 waypoint dropped for poor row structure
Staging between cotyledon and 4-leaf
12" row spacing
The Tele 1x labels were used to evaluate the common area in the Med-tele where the two frames overlap.
Results
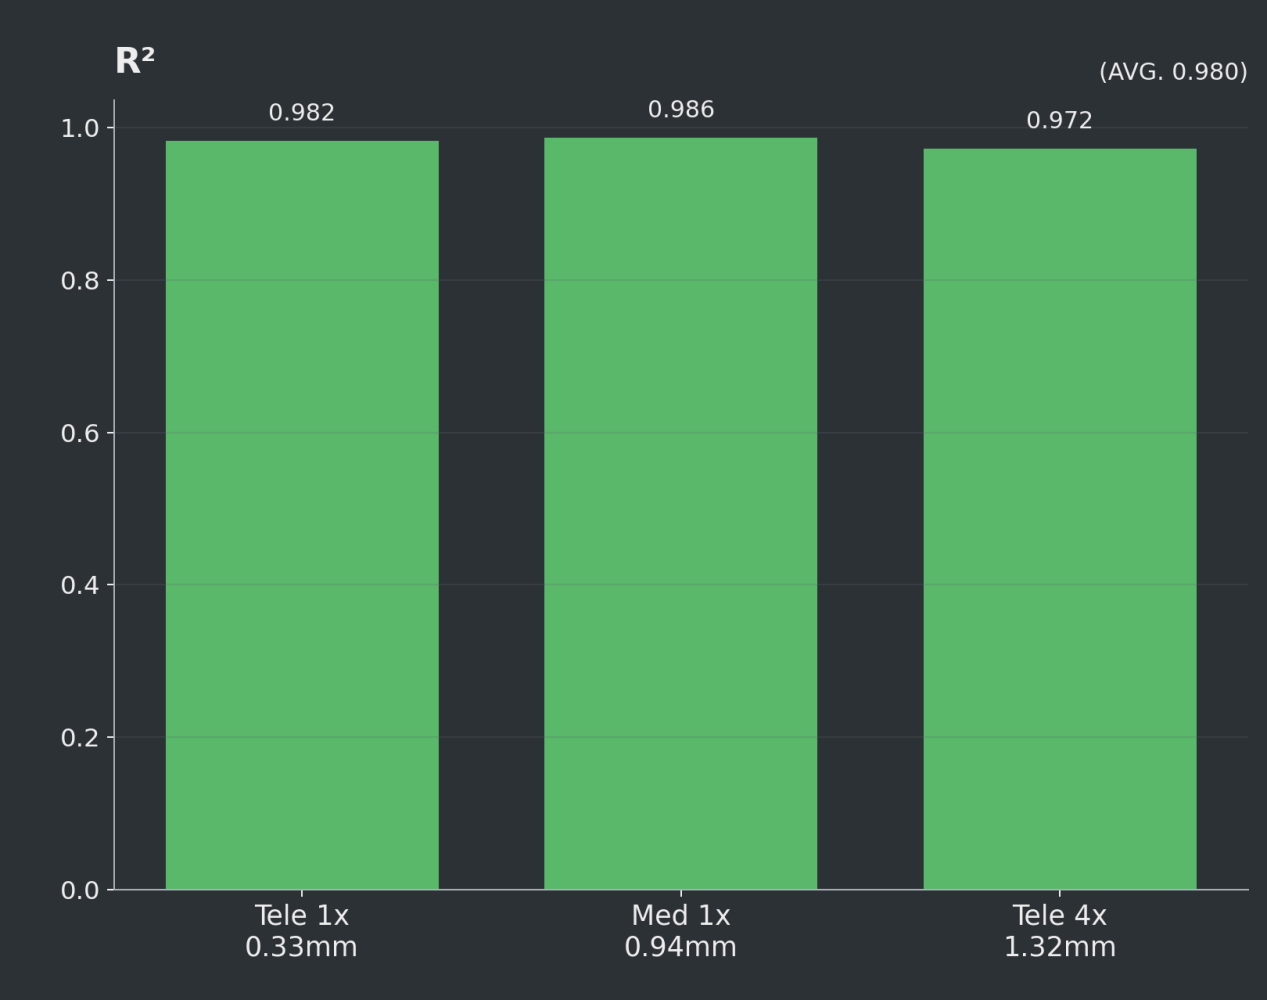
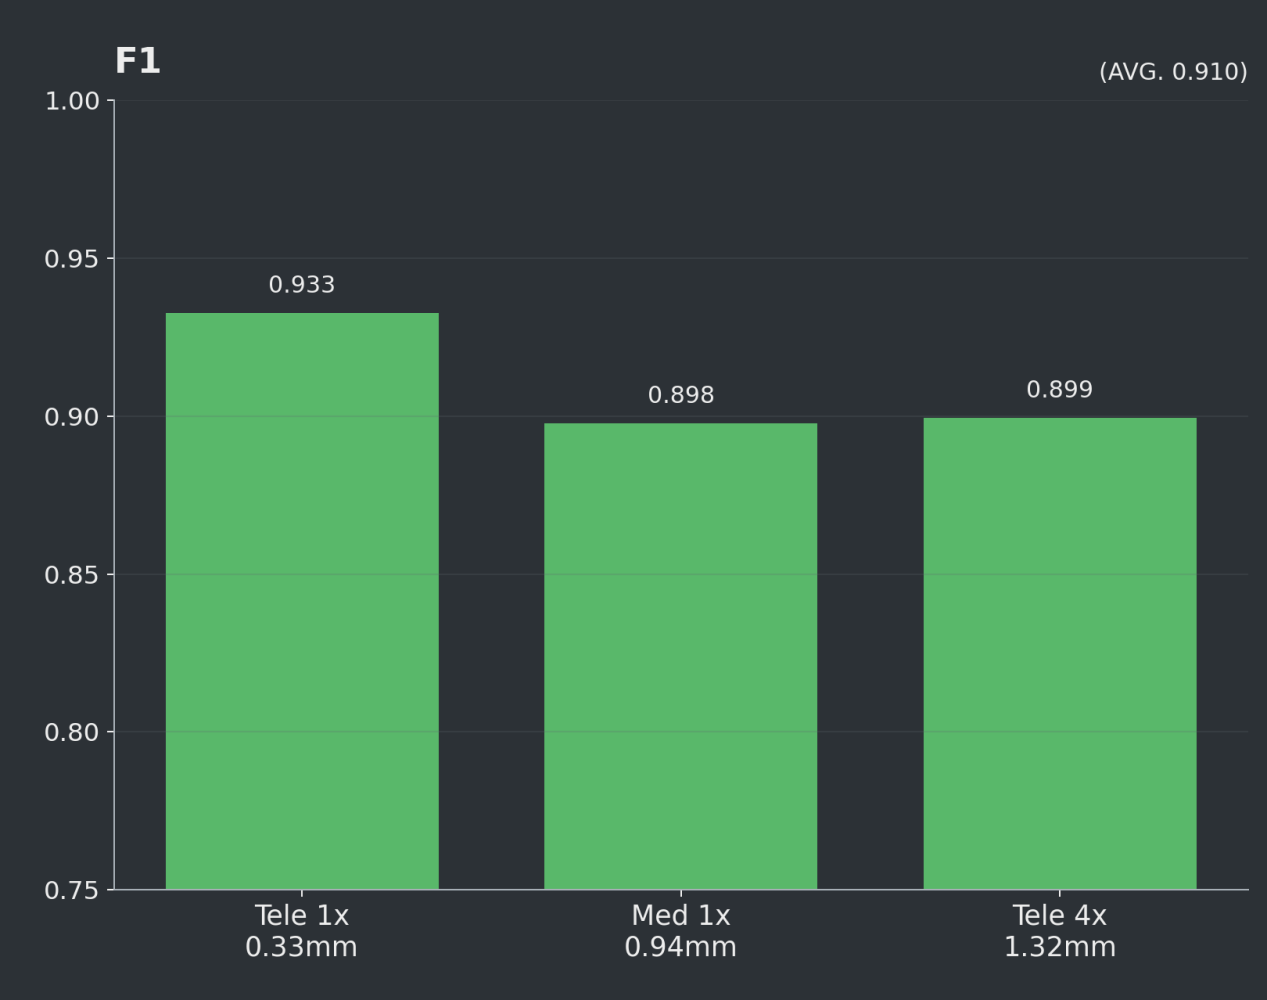
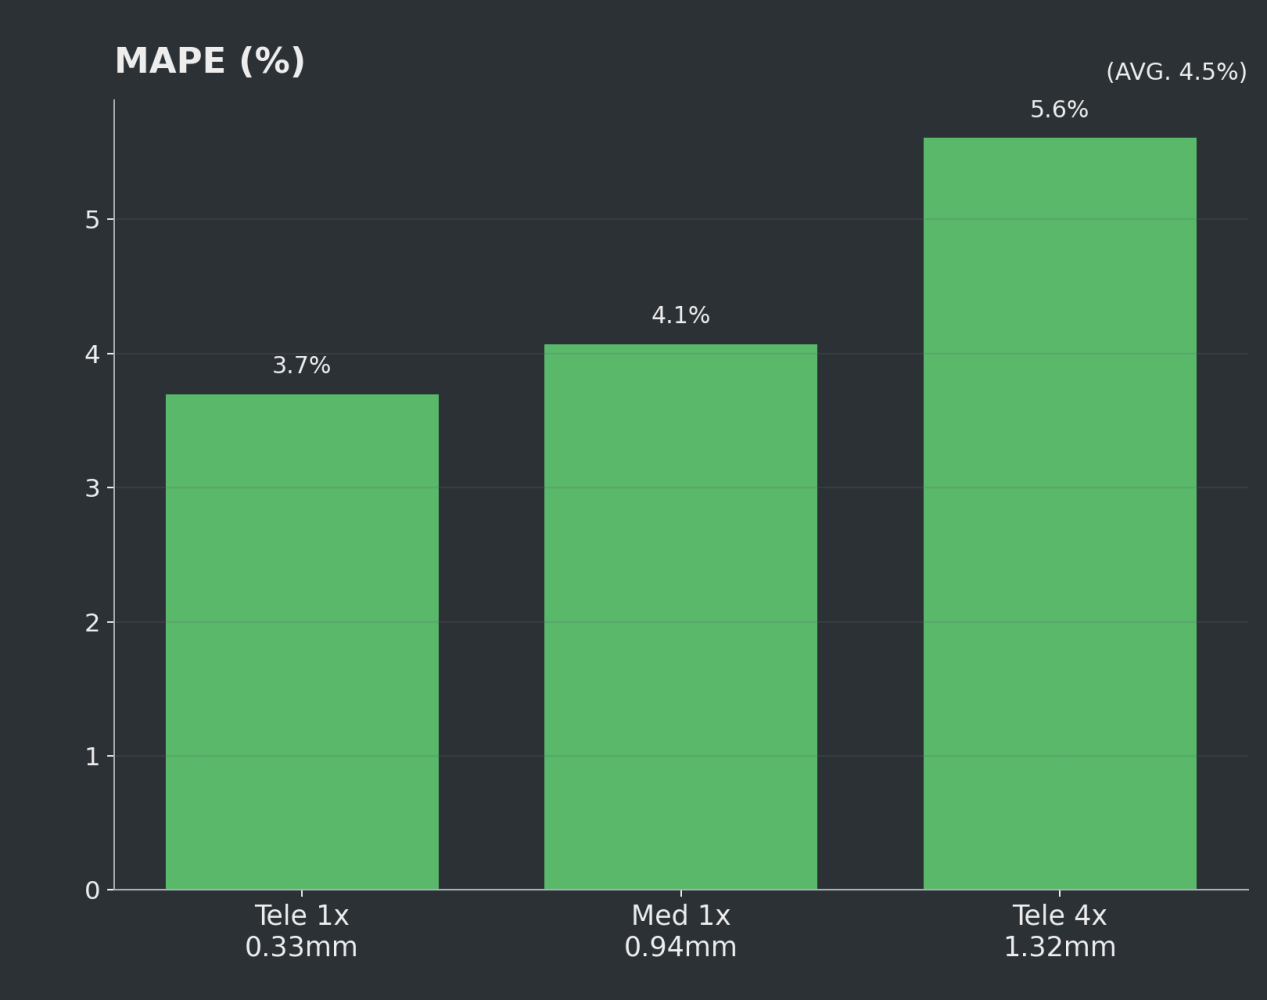
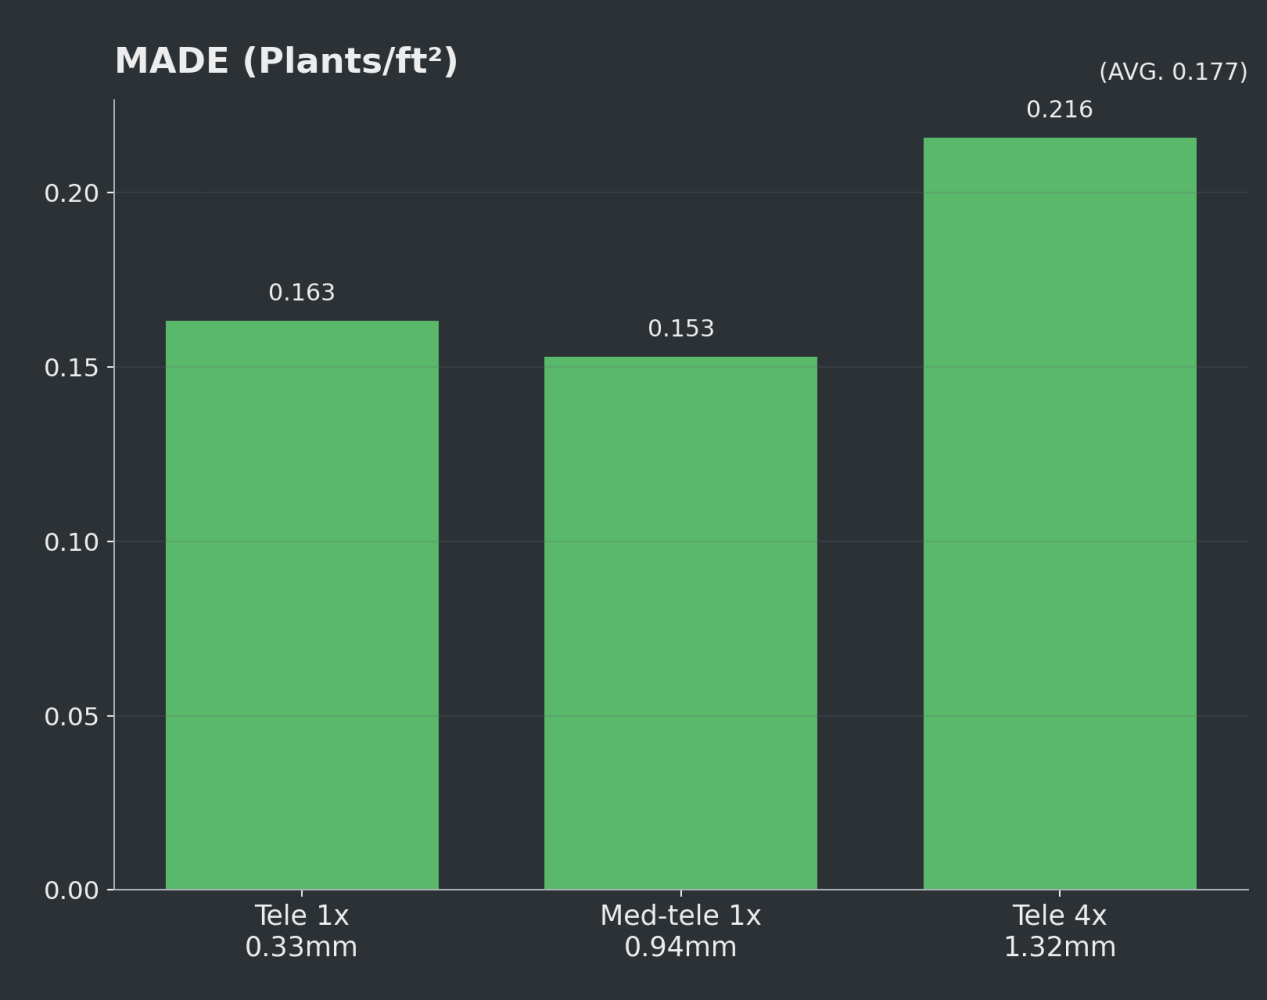
Tele 1x was the strongest overall detection stream
Med-tele 1x had the best count fit by R²
Tele 4x was the hardest of the three, but still held up well
Canola Prediction Performance
R² - How well do photo-level predictions match the pattern of truth?
F1 - How well do we find plants without missing or misidentifying them?
MAPE (%) - How much do photos vary from the truth?
MADE (plants/ft²) - How much do photos vary from the truth?
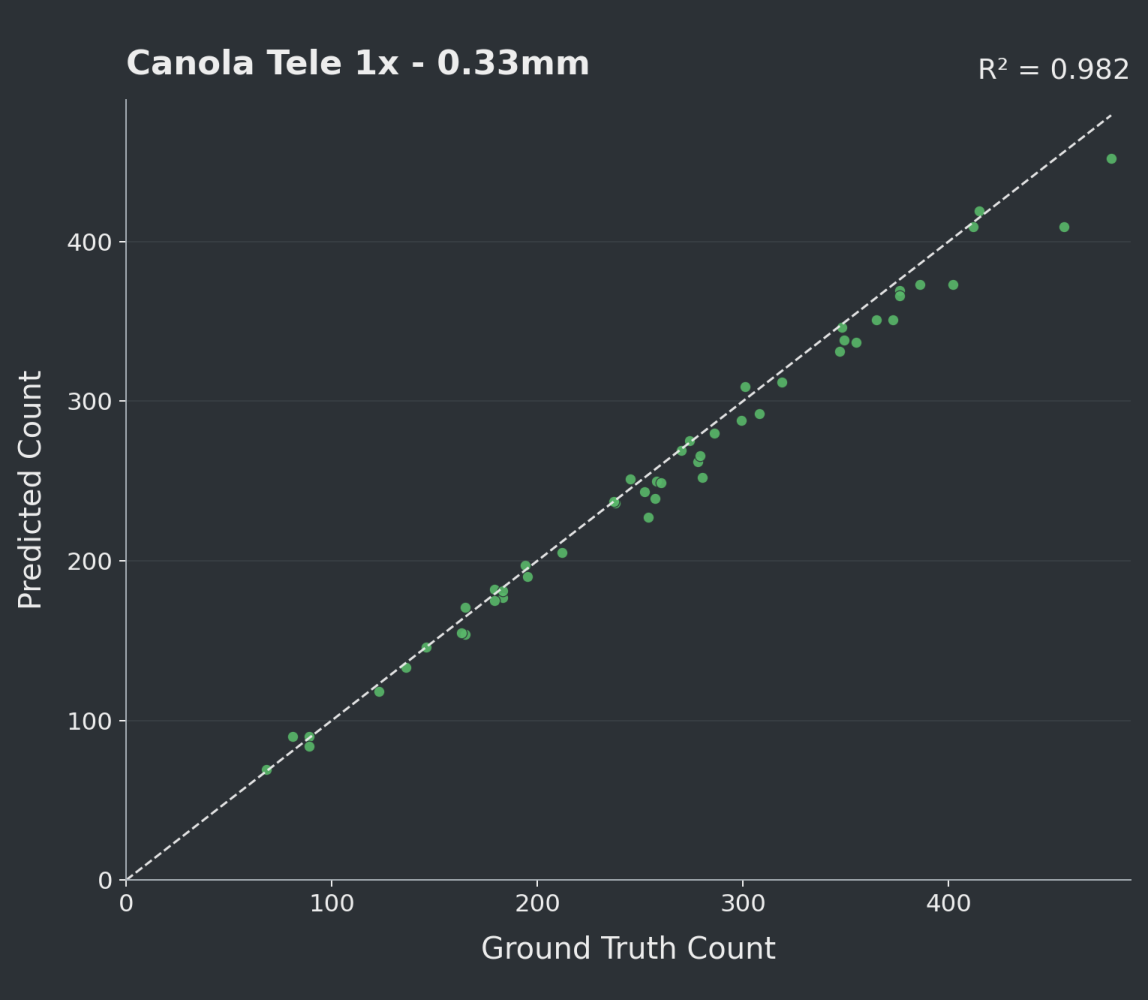
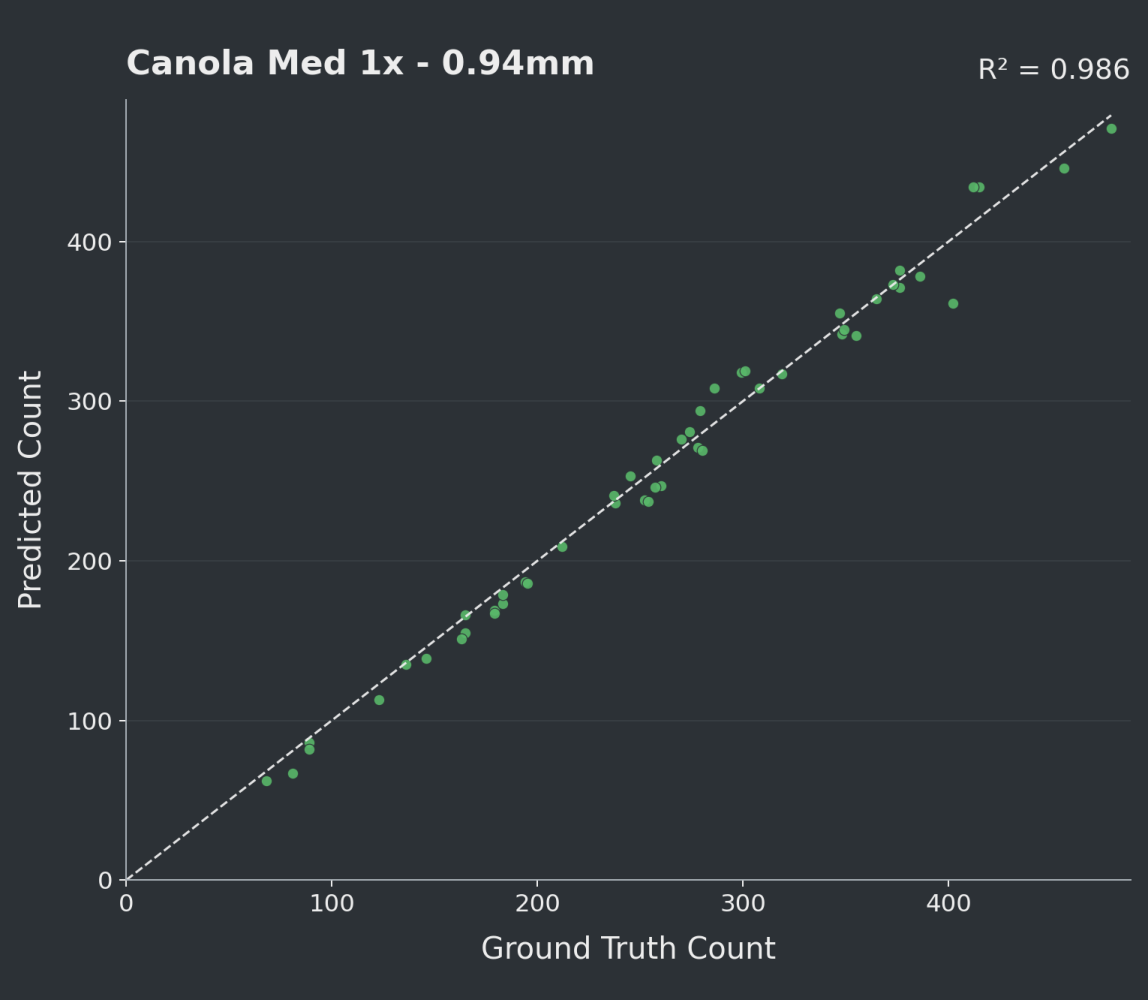
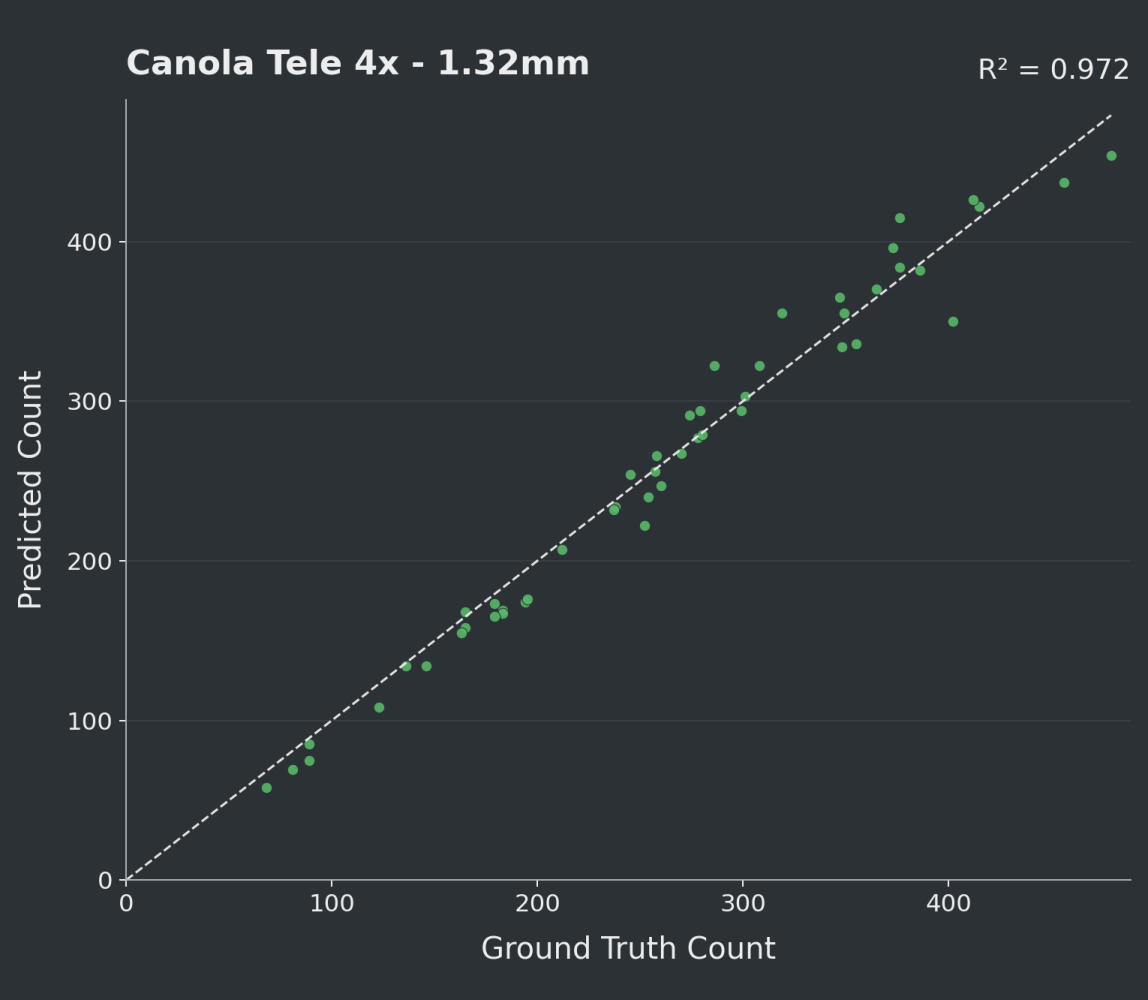
Predicted vs. Ground Truth Charts
Tele 1x (R² = 0.982)
Med-tele 1x (R² = 0.986)
Tele 4x (R² = 0.972)
Conclusion
Because this test field has similar soil and farming practices to the fields in our training set, these results are likely around the peak of what our model can do, and results will vary.
If you're outside of West Central SK, we have a true 'out of domain' dataset that we have evaluated against and will be sharing soon.
To increase coverage and robustness, we will continue to push accuracy at lower resolution by continuing to transfer labels across cameras during future missions.
Article highlights
0.24 to 1.91 mm/px
Count Training GSD
R² 0.986
Best Stream - Count Fit
F1 0.933
Best Stream - Per-Point
PlantCounts
Reliable stand data without hours of manual counting.
Built for agronomy in Saskatchewan.
© 2026 NovaScout. All rights reserved.