Case Study 2 - USask Canola Dataset
After training a model on data collected in West Central SK, we could find almost every plant in our test data, but still had trouble suppressing some types of weeds.
Looking around online, I found this 2024 paper published out of the University of Saskatchewan where they collected and labelled a canola count dataset.
We integrated their Train dataset into our pipeline to improve weed robustness and generalization under wetter, darker soil conditions. After training our updated model, we evaluated performance on their two test sets.

Counting Canola: Toward Generalizable Aerial Plant Detection Models
Erik Andvaag, Kaylie Krys, Steven J. Shirtliffe, and Ian Stavness
This dataset was released under the Creative Commons Attribution 4.0 (CC BY 4.0) license. You can access the dataset here. License: CC BY 4.0.
USask Canola Dataset
This dataset is broken into three folders:
Train
ID (In Domain)
OOD (Out of Domain)
We used Train to improve our model and have evaluated performance against the ID and OOD test sets.
OOD Test photos that our previous model struggled with


Results after training with the USask Train dataset


Difference in Approach
The key difference between the approach taken in the paper and PlantCounts, is model architecture and the type of outputs that each models produces.
The USask model is an object detection model (YOLOv4 Tiny) that produces bounding box annotations.
Our model is a transformer which produces center-point annotations.
The blue boxes shown in the photos above are set to fixed size around our center predictions (not true bounding boxes).
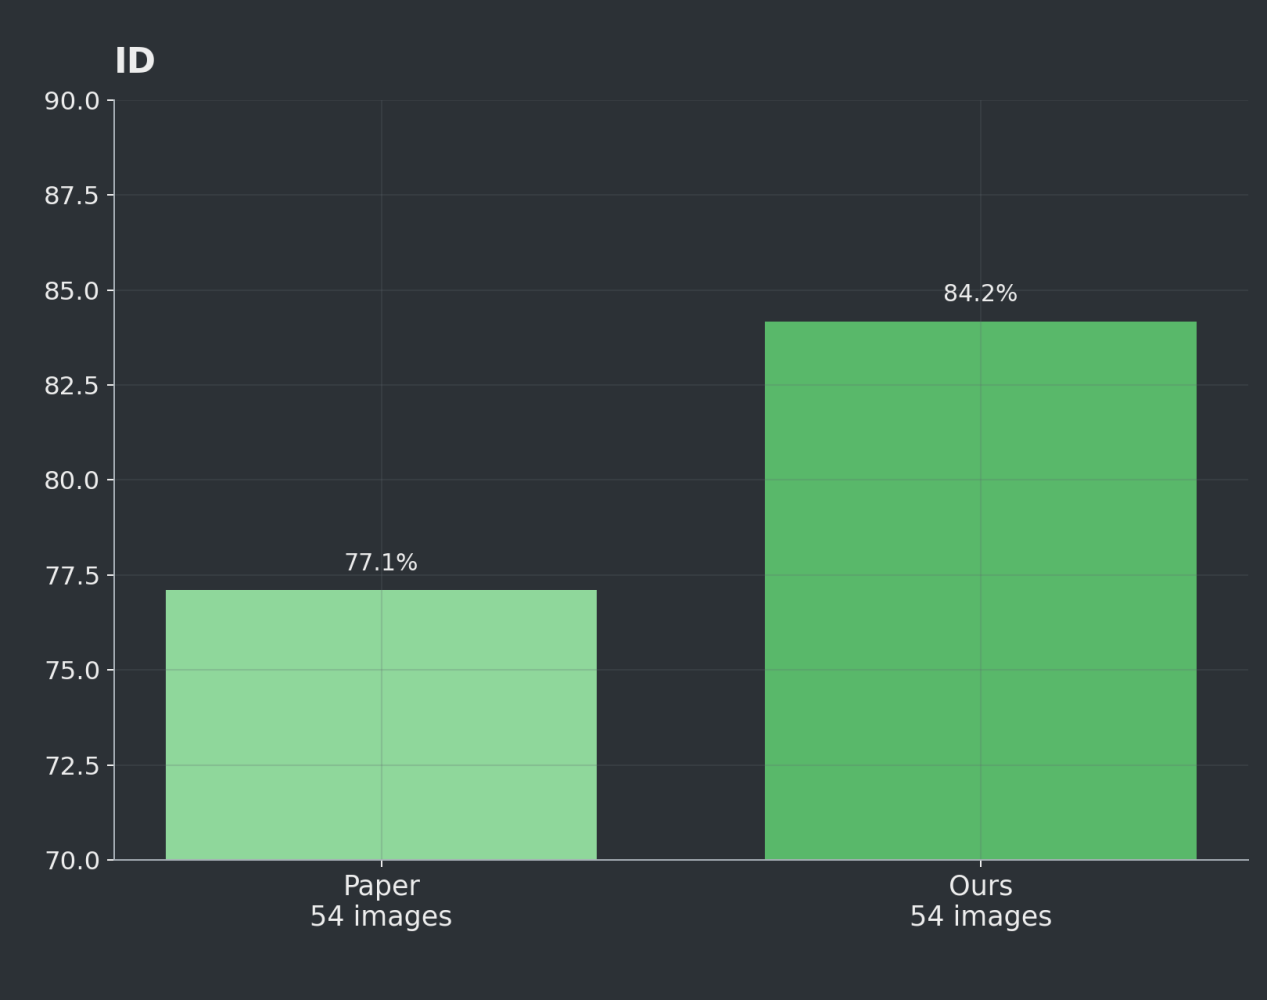
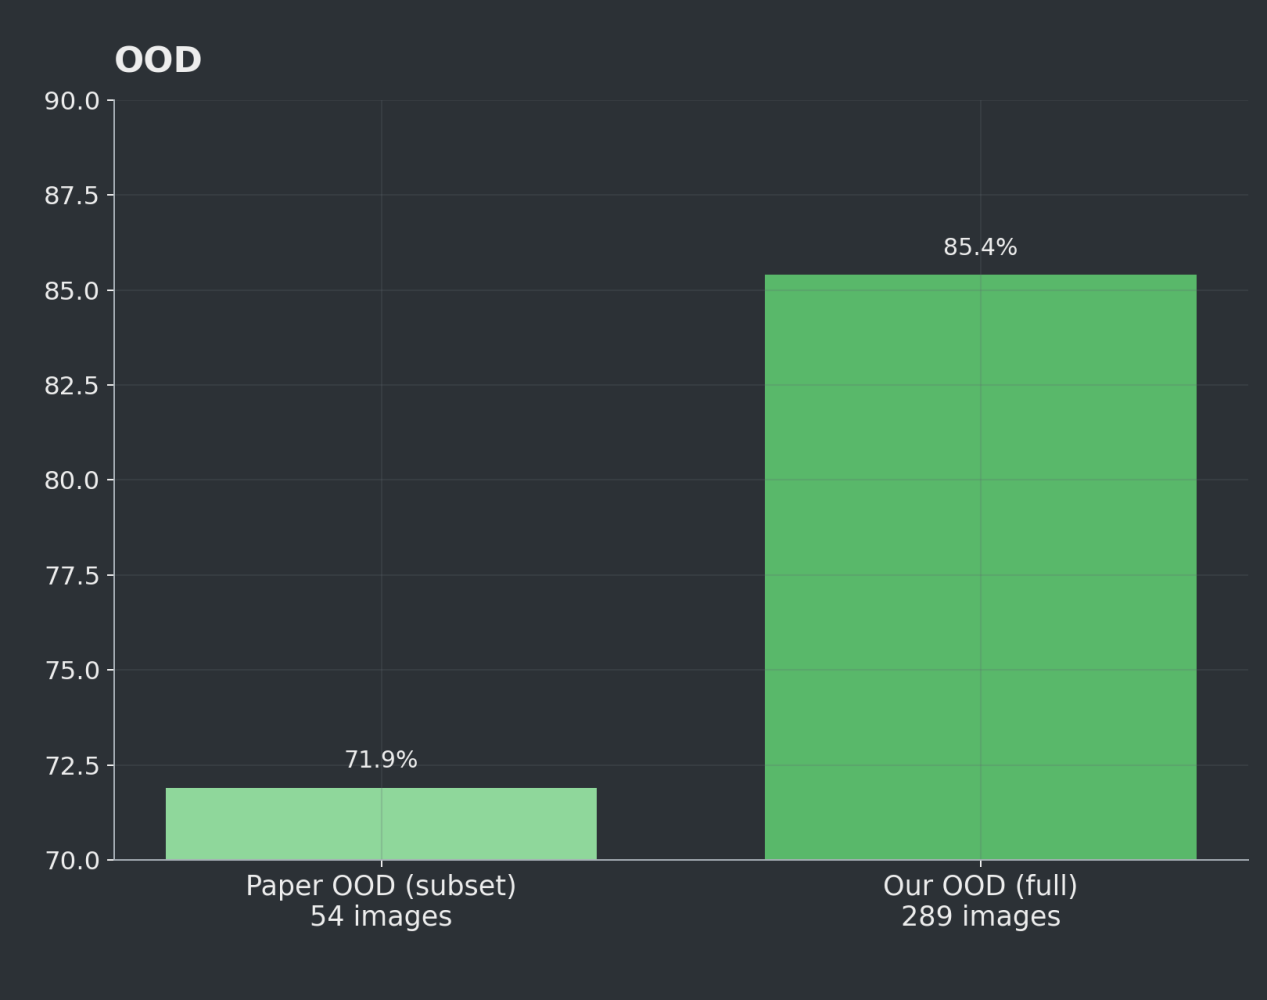
OOD - 290 vs. 54
Another important difference is that the OOD set that we evaluated against was 290 photos while the one in the paper is a subset of 54. Both approaches are evaluating on the same 54 photo ID test set.
Metrics and Evaluation
The main performance metric in the paper is Accuracy, as defined by:
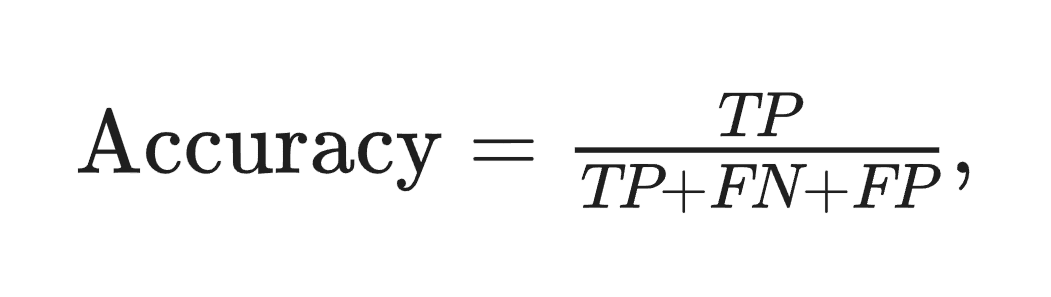
This metric excludes true negatives and focuses only on detection outcomes: correct detections, missed plants, and extra detections.
It can be interpreted as the overlap between predicted and true plant detections, making it stricter than F1.
F1 uses (2 x TP) in the numerator and denominator, so it gives additional weight to true positives and will always be equal to or higher than this metric for the same TP, FP, and FN values.
True Positive Definition
In the bounding-box approach, a true positive is determined by overlap between a ground-truth box and a predicted box.
Because our model predicts plant center points instead of bounding boxes, we define true positives using distance-based matching:
Build a distance matrix between every predicted point and every ground-truth point.
Exclude any pair farther than 2.5 cm.
Run Hungarian / minimum-cost assignment on the remaining valid pairs.
Assigned pairs within the radius are counted as true positives.
Unmatched predictions are counted as false positives.
Unmatched ground-truth points are counted as false negatives.
Filtering
We dropped one photo from the 290 photo OOD dataset which was taken at a much higher altitude than the rest. This was labelled as a True Negative (no plants), but because our model is GSD robust, we ended up finding a few canola plants anyway - so we excluded it. Pretty neat!
Note - Our row detection doesn't work at this scale, so don't collect this high up.


Results
These results show how transformers can improve on bounding box models for agronomic vision tasks. Given the OOD dataset composition (289 vs. 54 photos), the best comparison is the ID test set.
ID Test Set - Paper (YOLOv4 Tiny) vs. Ours (transformer)
OOD Test Set - Paper (YOLOv4 Tiny) vs. Ours (transformer)
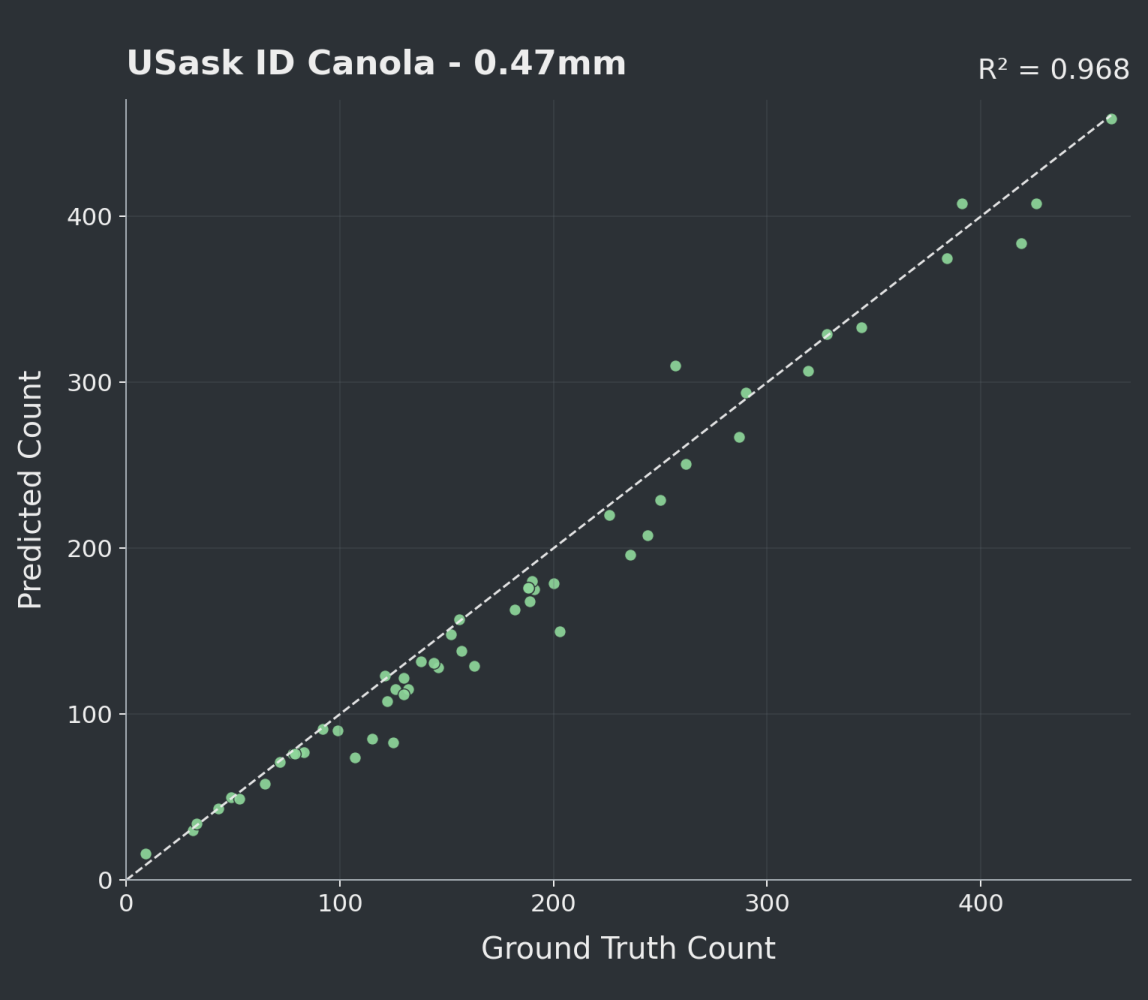
ID - Predicted vs. GT Counts
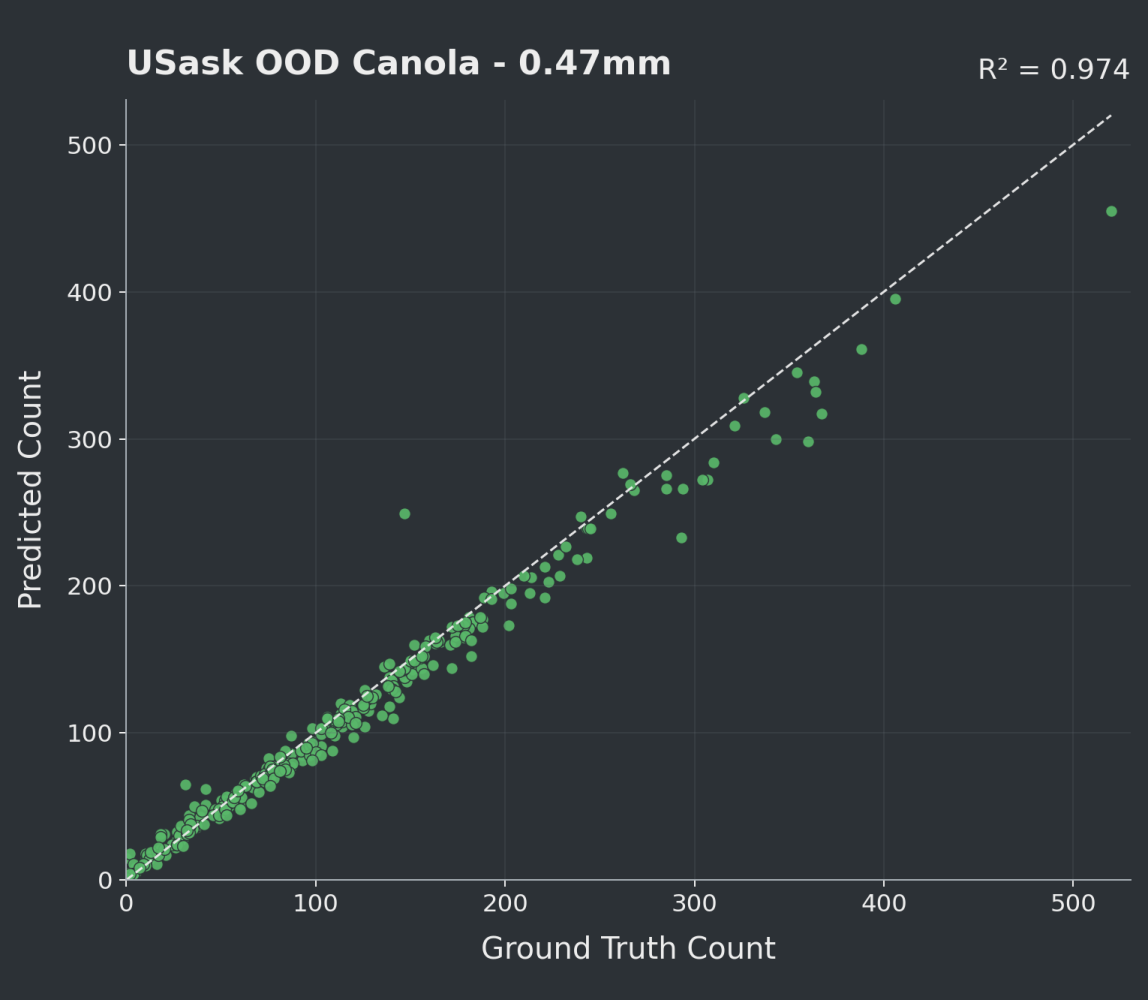
OOD - Predicted vs. GT Counts
Worst of the 343 Total Test Photos
One bad escape like this on 343 test photos isn't terrible, but still room for improvement.
The point that stands out here is at (140, 250). This is a case where our model misidentifies annual weeds that are just coming out of the ground for canola seedlings. It does suppress some of the weeds, but not all. The blue markers here are our predictions, and the white cornered squares are the true labels.

Internal Results for Comparison
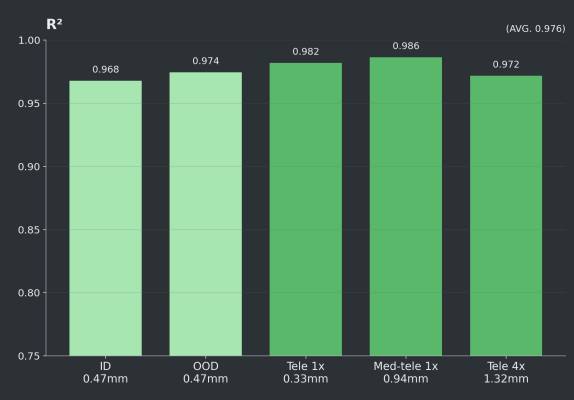
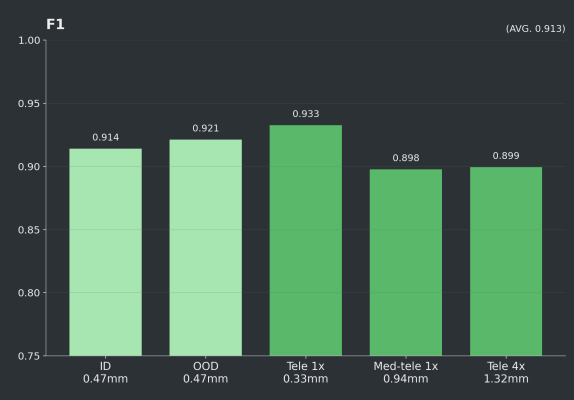
Here are some additional metrics we've recorded so the results can be compared to our Tele vs. Med-tele test sets evaluated in Case Study 1.
R² - How well do photo-level predictions match the pattern of truth?
F1 - How well do we find plants without missing or misidentifying them?
MAPE (%) - How much does each photo vary from the truth?
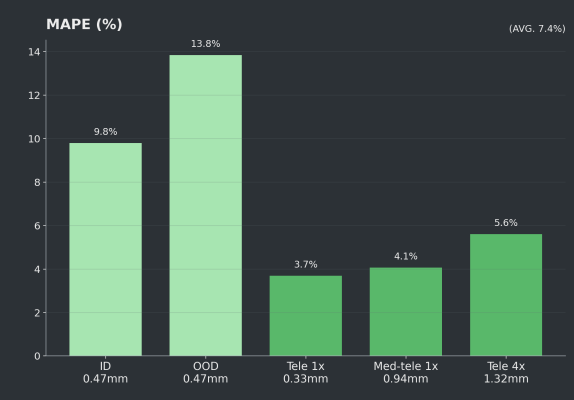
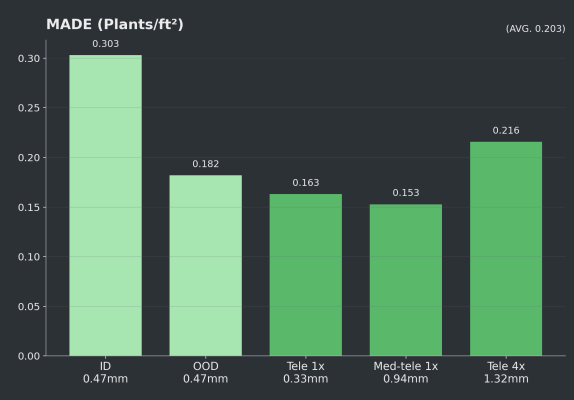
The ID and OOD datasets had many photos at or near 0 plants, so even small errors on these photos can inflate MAPE. The next chart (MADE) shows that OOD with 13.8% error is still only off by 0.18 plants/ft², and 9.8% error on the ID translates to a density error of 0.30 plants/ft² - which is acceptable for most use cases.
MADE (plants/ft) - How much does each photo vary from the truth?
Conclusion
First, having access to this data really did help, so I am thankful to the authors of this paper for their work and for making this data publicly available.
The Counting Canola paper showed that adding diverse data improves the model more than scaling data alone. Our results confirm this, showing that a wider training set in terms of soil type and weed variety can improve generalization for new fields.
We achieved strong performance on both USask in-domain and out-of-domain imagery, with ID results of F1 0.914, accuracy 0.842, R² 0.968 across 54 images, and OOD results of F1 0.921, accuracy 0.854, R² 0.974, across 289 images.
When the training data is diverse and the counting pipeline is well calibrated, robust canola counting with drone photos becomes realistic and efficient.
Article highlights
54 images
ID evaluation set
289 images
OOD evaluation set
0.974 / 0.921
OOD R² / F1
PlantCounts
Reliable stand data without hours of manual counting.
Built for agronomy in Saskatchewan.
© 2026 NovaScout. All rights reserved.